Helios V2
An experimental rewrite of Helios as a 3D graph-based interface built in Godot — exploring the idea of making the data structure itself the UI.
What is Helios V2?
Helios V2 was a ground-up rewrite of Helios that replaced the traditional web dashboard with a fully 3D, graph-based interface built in Godot. The backend remained dockerized, but the frontend became something entirely different — a navigable 3D space where you fly through the Neo4j knowledge graph directly.
The core idea was radical: the data structure itself IS the UI. Every feature, every conversation, every journal entry — they’re all nodes in a single interconnected web that you can see, navigate, and interact with.
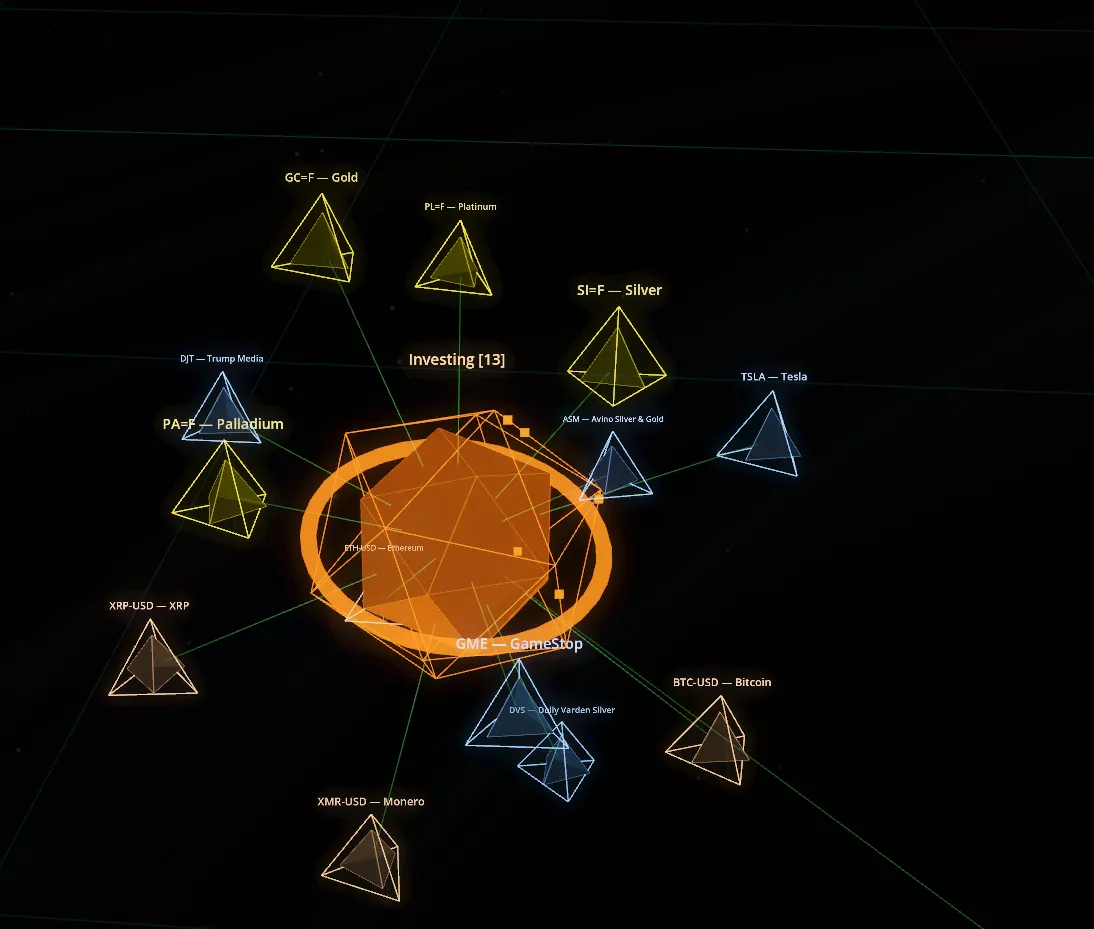
The Graph Interface
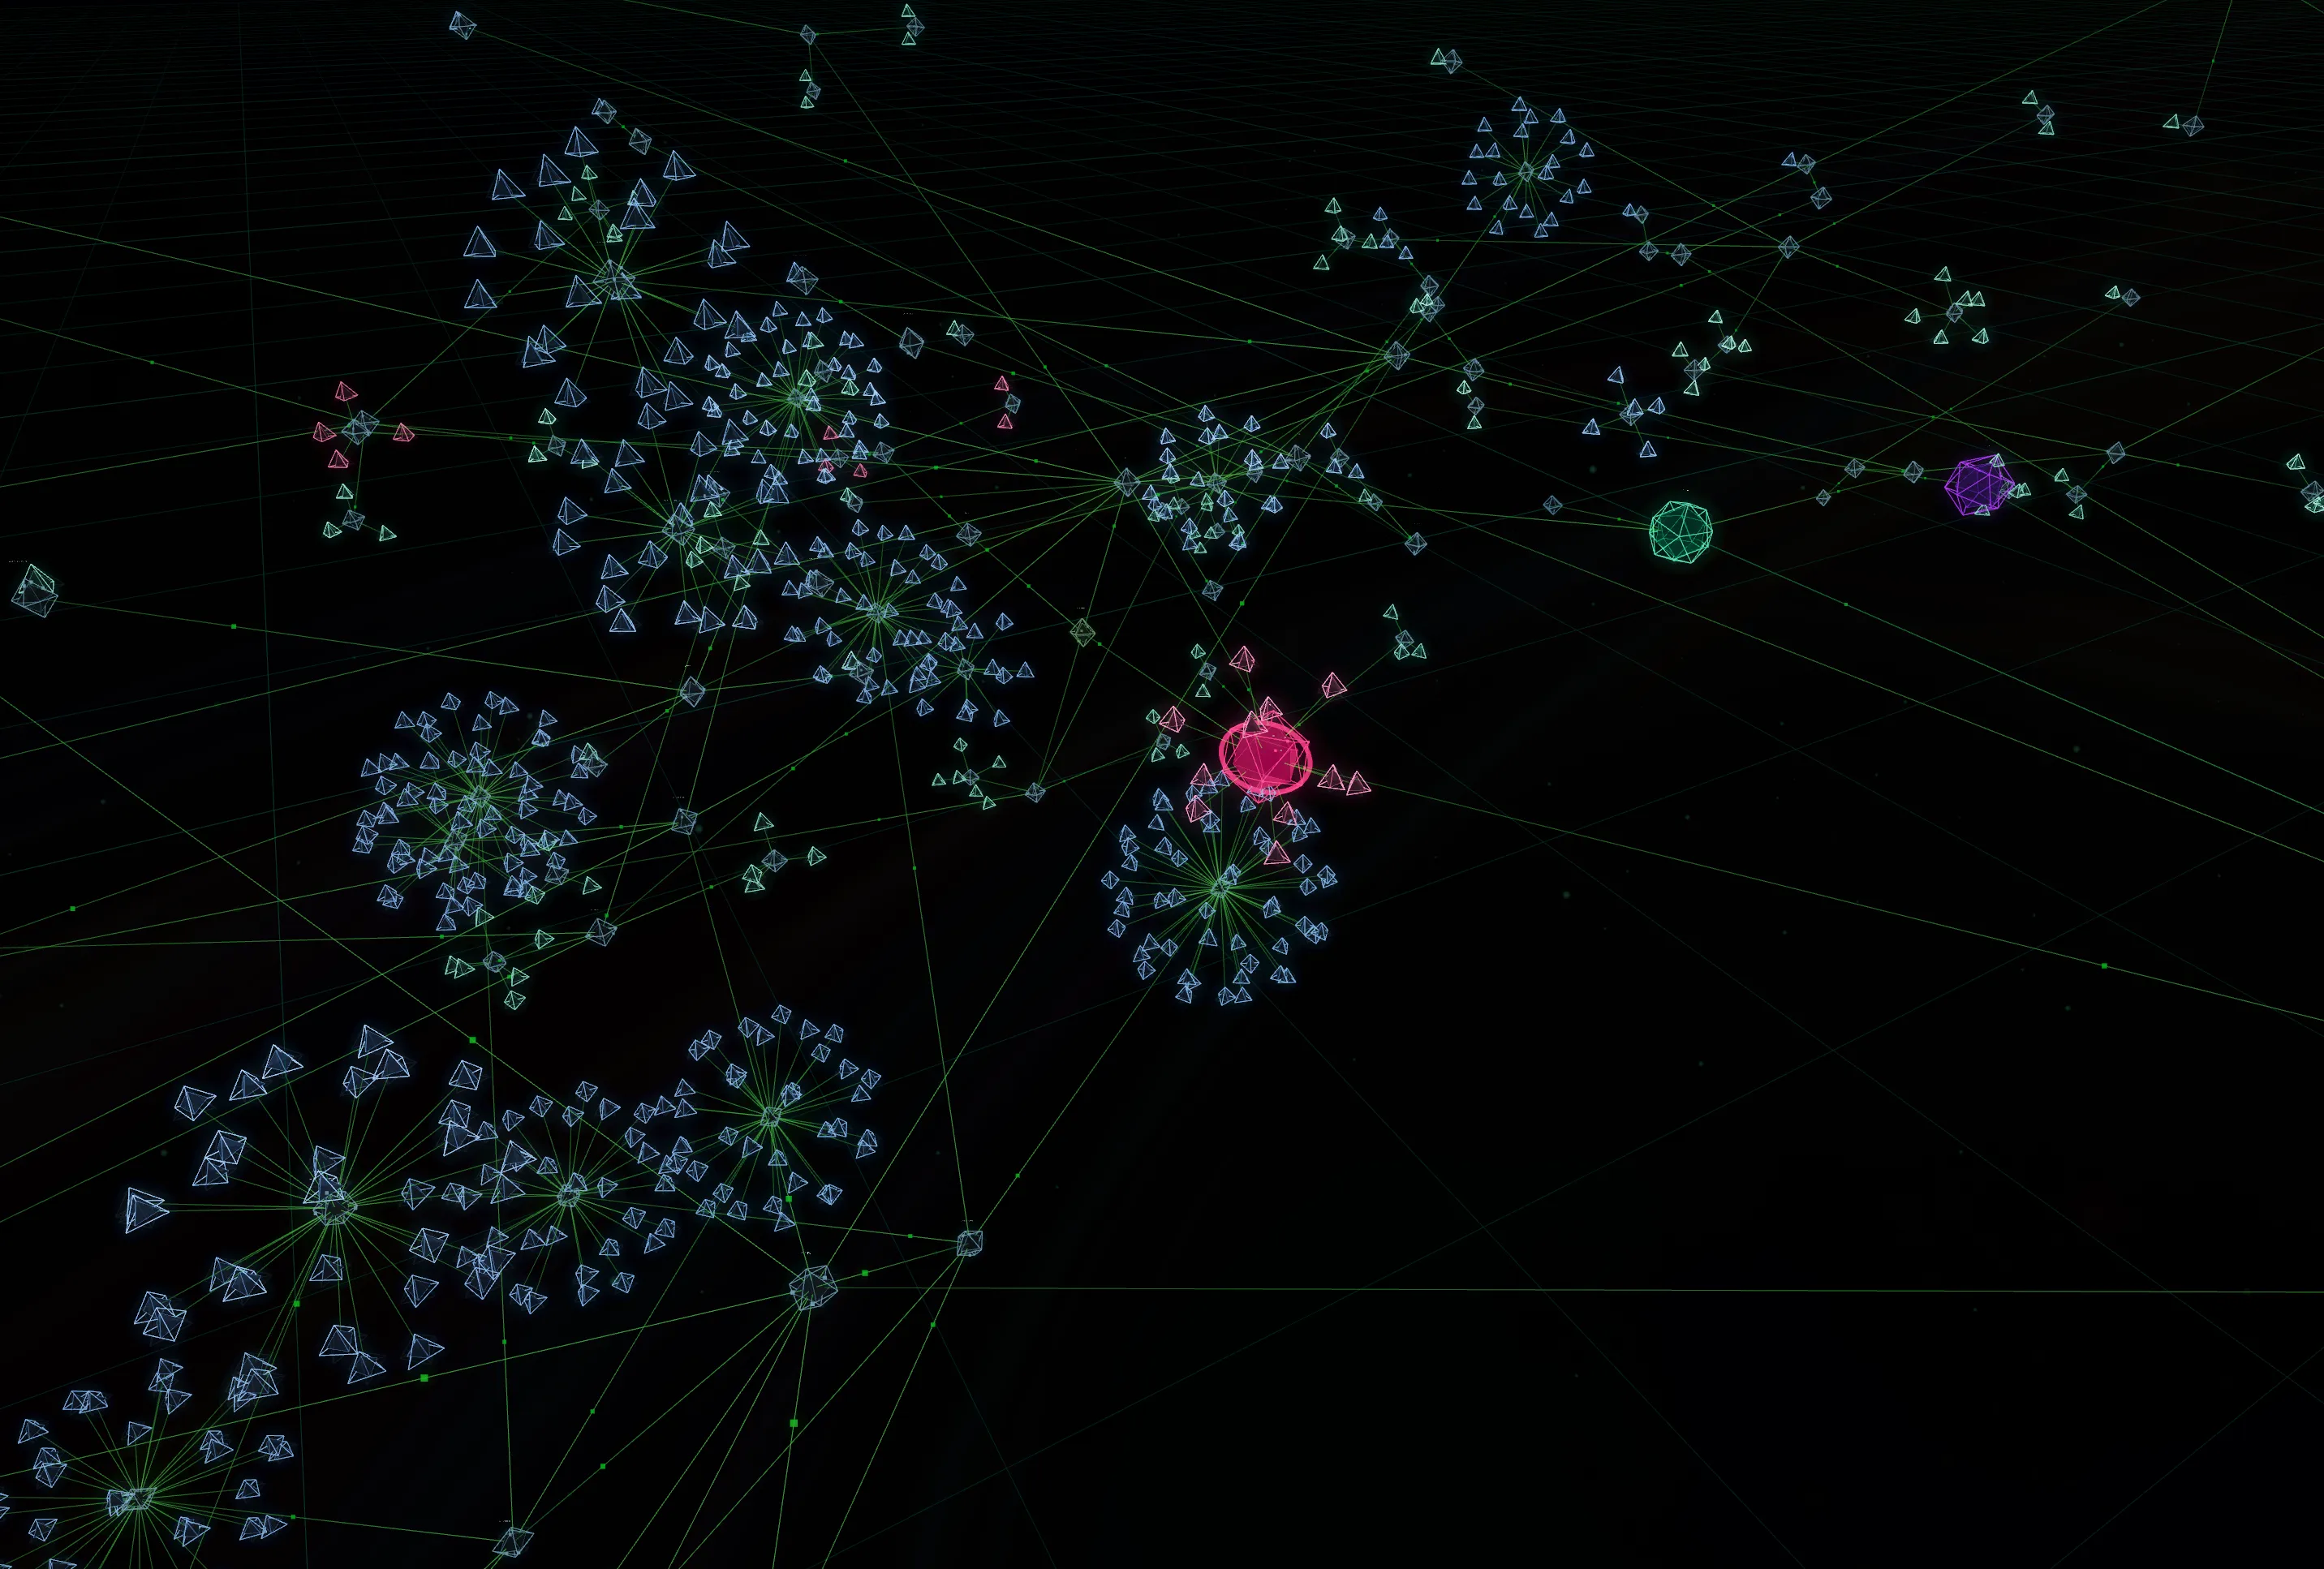
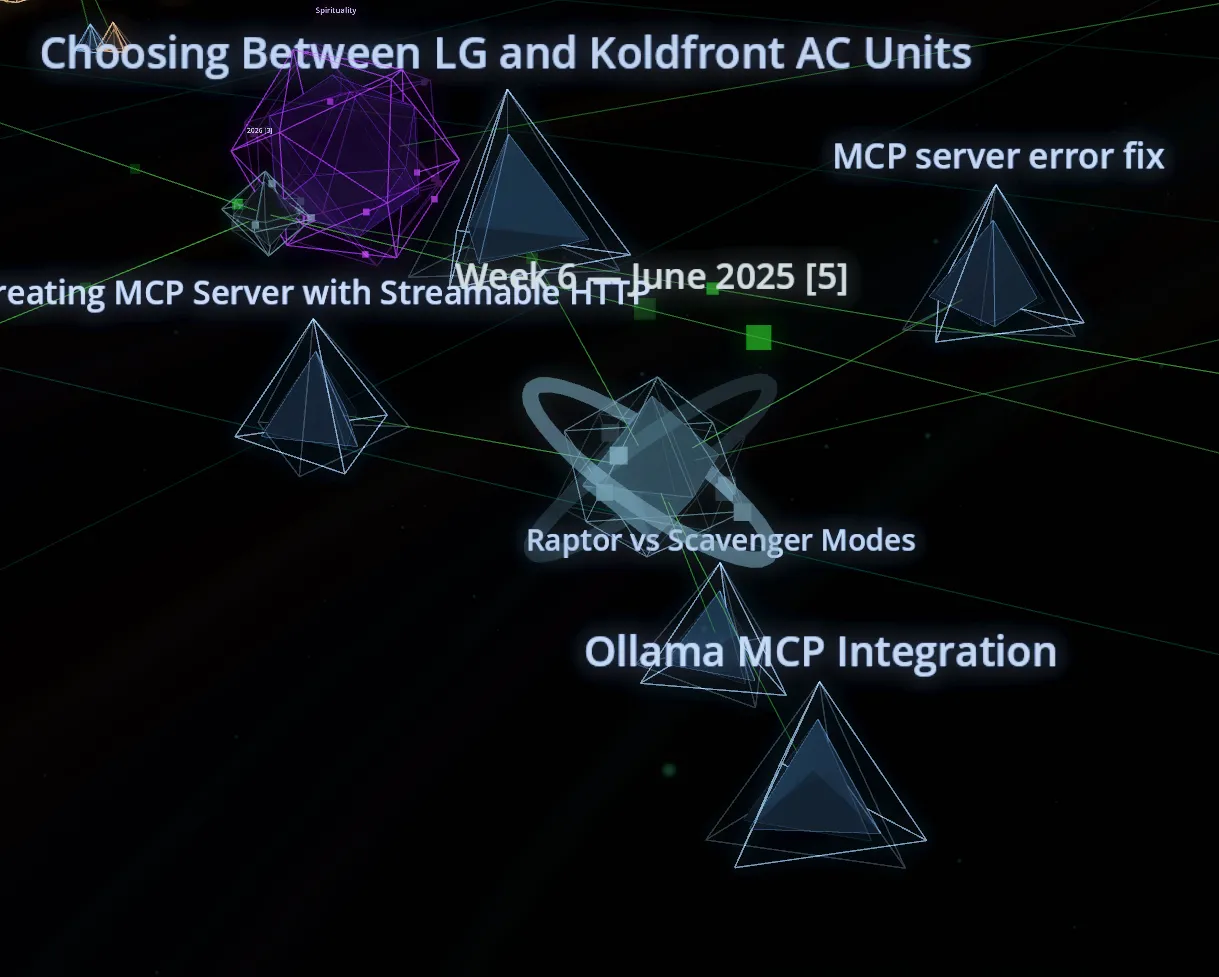
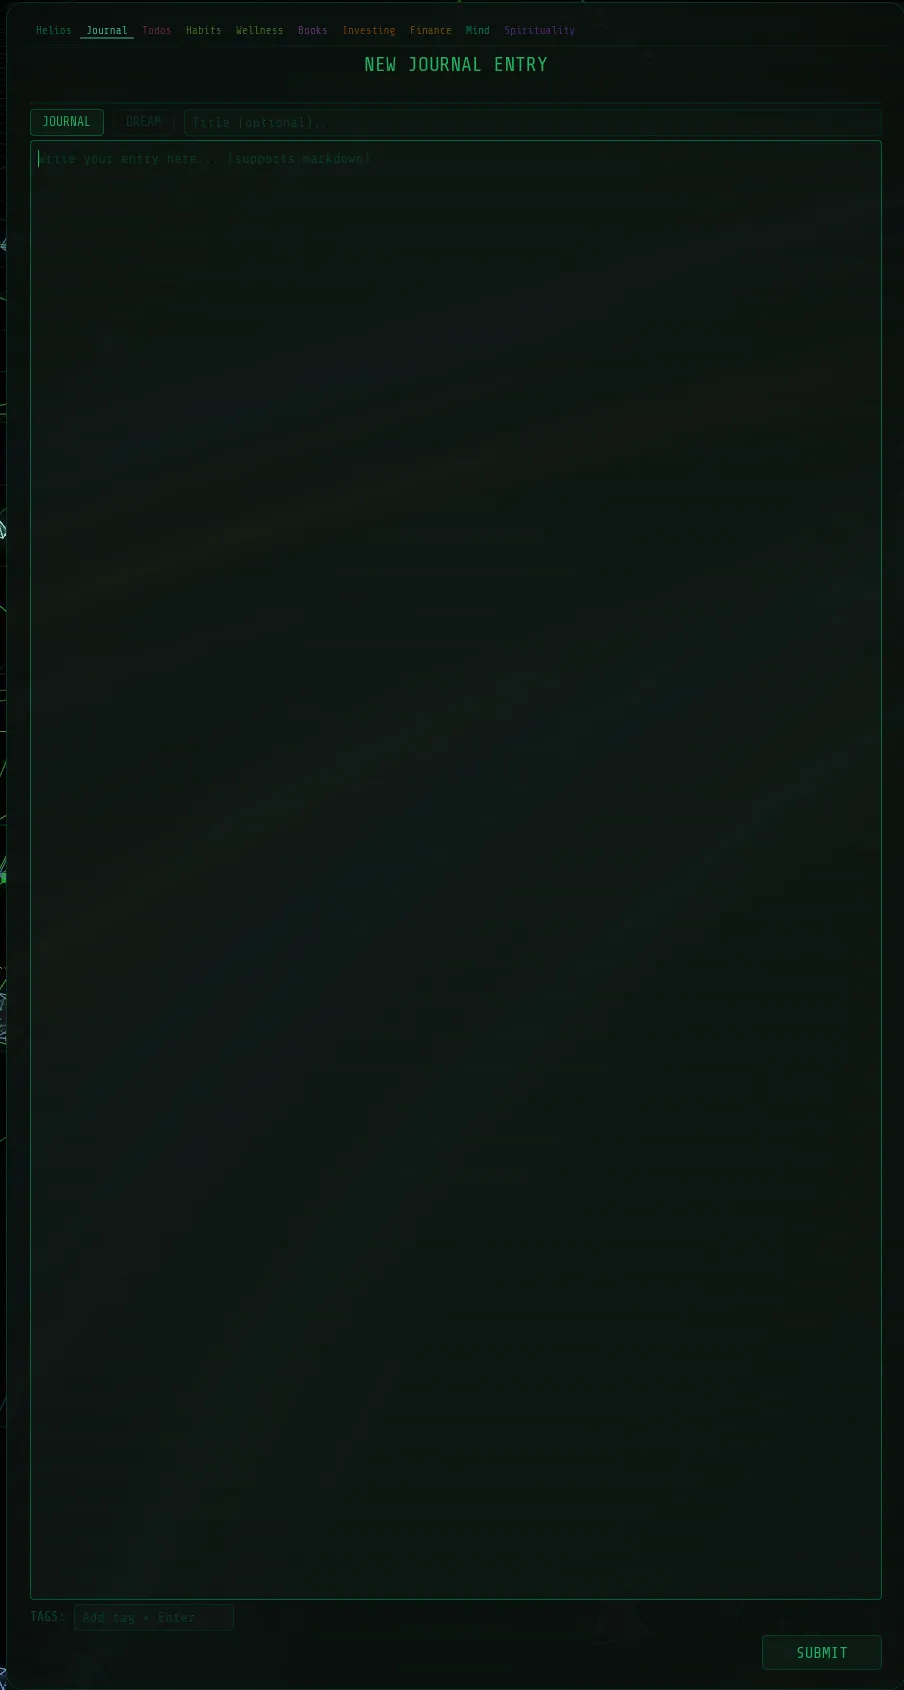
The central node is the Helios “sun” — the main AI interaction point where you talk to the assistant. Branching off from it are feature nodes (journal, investments, todos, home control, etc.) and the current day’s conversation nodes. Selecting any node opens its associated panel.
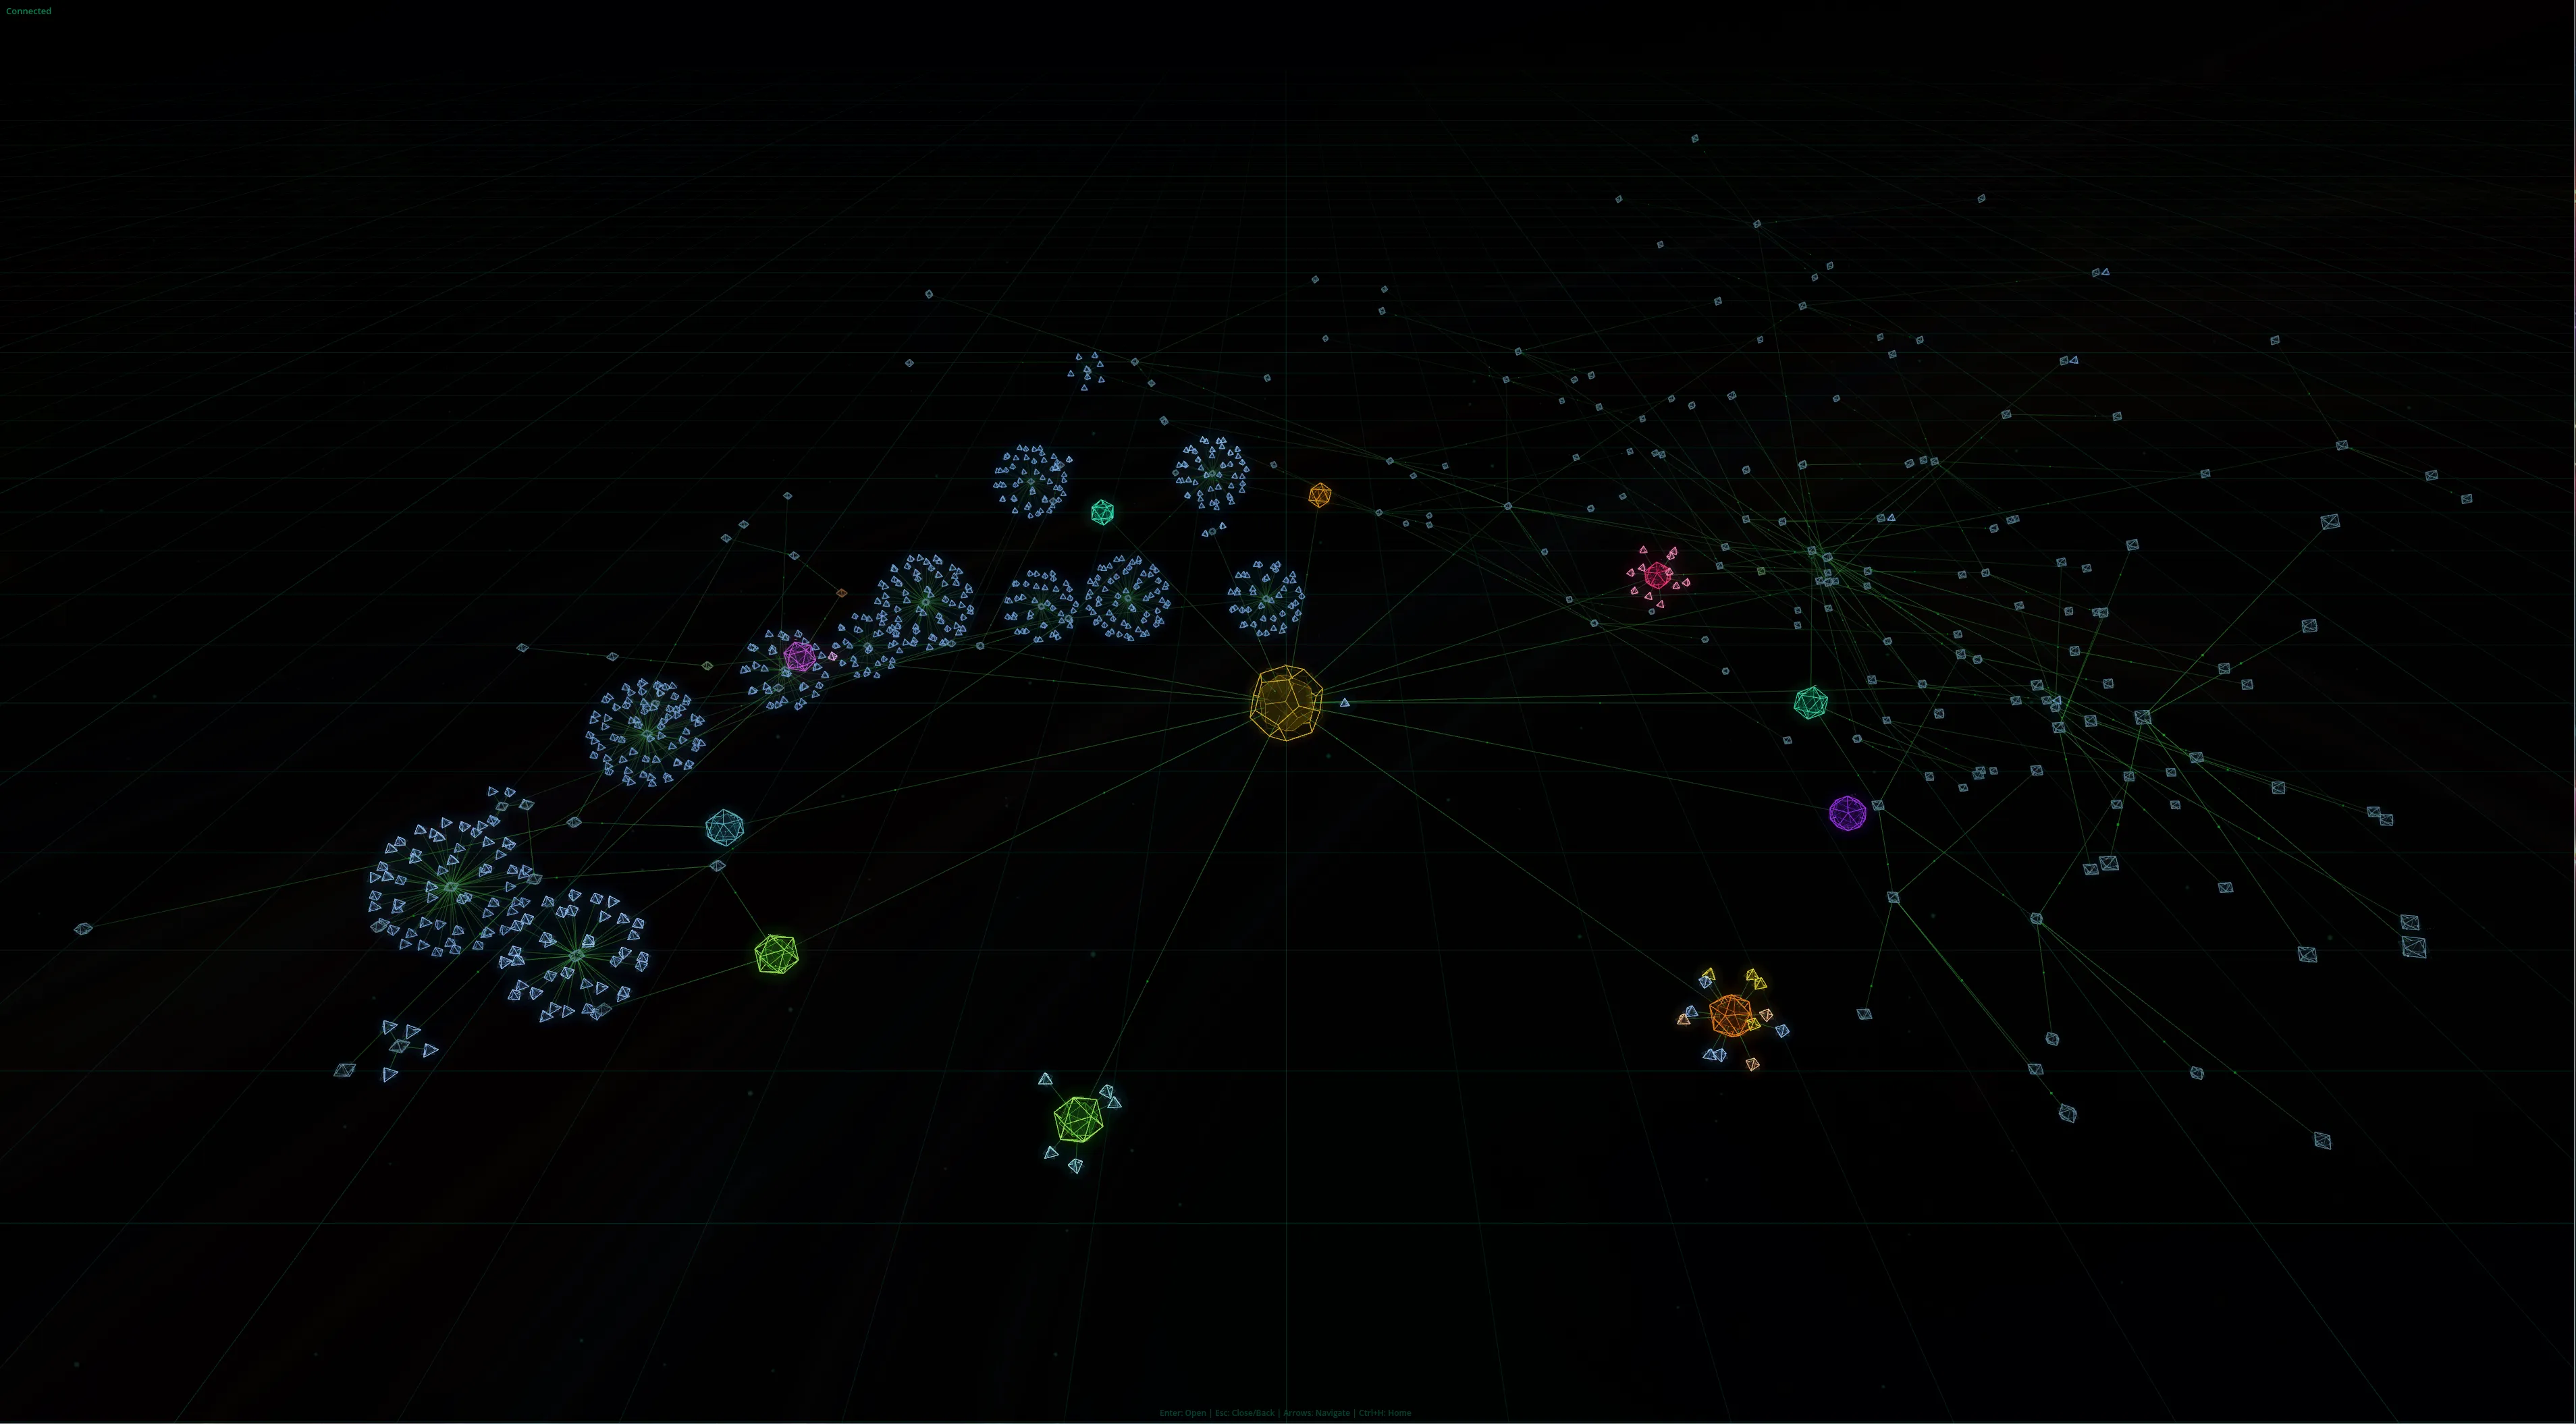
Data is organized into time buckets. Conversations, for example, branch off from a “past conversations” node into year > month > week > individual conversation nodes. The current day’s conversations live directly off the central sun and get moved into their appropriate time bucket at midnight. Journal entries follow the same pattern — each saved entry spawns a new node, organized into year > month > week > entry.
Dimensional Views
One of the more interesting concepts was viewing the same graph through different “dimensions”:
- Earth (default) — hierarchical view, nodes organized by their structural relationships
- Air (semantic) — nodes with similar meaning are connected and pulled together
- Fire (resonance) — organized by frequency of access, most-used nodes closest to center
- Water (spiral timeline) — order of addition dictates position, most recent closest to center
- Aether (idea realm) — only extracted concept nodes are visible, showing how ideas evolved over time
These could also be combined — set a view to “70% Earth, 30% Air” to blend hierarchical structure with semantic clustering. It ends up being a genuinely powerful way to find unexpected connections in your data.
Features
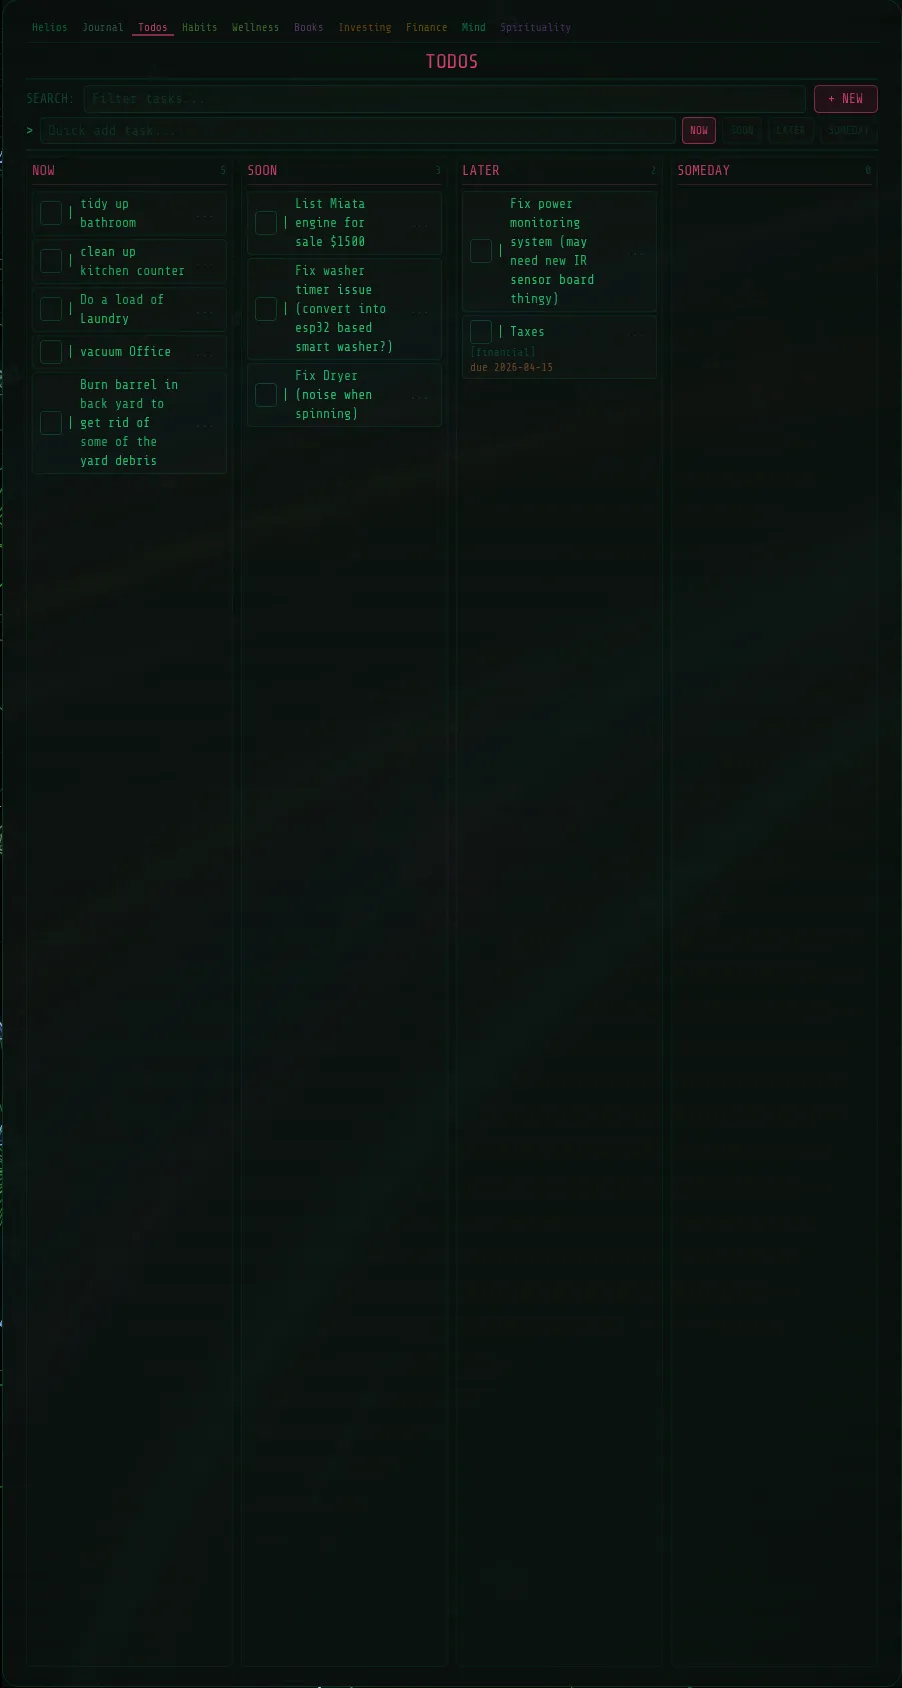
Despite being abandoned early, a number of features were functional:
Technical Challenges
2D to 3D. The project started as a 2D graph, but with 3-5k nodes (expanding almost indefinitely as conversations, journal entries, and financial transactions each generate their own node), there simply wasn’t enough space on a 2D plane. Nodes either overlapped or were too far apart to see connections. Moving to 3D solved this — cubic volume vs. square area is a massive difference.
Performance. Rendering thousands of individual nodes was too slow. Switching to instanced mesh rendering (render each node type once, draw it at every node position) was a huge win. I also developed an algorithm to only expand time buckets and supernodes that were in the camera’s view, contracting off-screen ones to save resources. Getting that balance right — not expanding when they should, staying expanded when they should collapse — was a constant challenge. By the end I had it under 20% GPU usage on a 3090 at 4K, but that was still more than I wanted to dedicate to a frontend when the GPU needs to be available for AI workloads.
Android. I did get an Android version working and it ran surprisingly well, but it was a large/demanding app just to turn on your lights or do something basic.
Why I Stopped
The concept is genuinely cool for data exploration — finding relationships between a conversation about an item, a financial transaction for buying it, and a journal entry about how you felt about it. But for daily use as an AI assistant, it’s inconvenient. If you just want to turn off your lights or check your investments, navigating a 3D graph takes more time than clicking a tab on a webpage. I tried adding tab shortcuts on the feature panels, but it still couldn’t match the speed of a traditional interface for basic tasks.
What I Learned
The biggest architectural lesson: the tight coupling between Helios V1’s dashboard and its backend meant I had to start from scratch for V2. And now, V2’s graph interface is so deeply integrated that moving on means starting over again. This is driving the design of Helios V3 — fully modular, so each component (core, financial, journal, home control, and potentially even this 3D visualization as an optional module) can be developed and swapped independently. V3 will also be the first open-source Helios, up on GitHub.
I may revisit the graph interface someday as a dedicated data visualization module that plugs into Helios — a high-end tool for drilling into connections between your data, rather than the primary way you interact with the system.